


Business intelligence software helps business owners transform everyday sales, customer, inventory and payment data into decisions they can act on. Instead of guessing which products sell best, which services bring in the most revenue or why cash flow feels tight, you can use reports and key performance indicators (KPIs) to understand what is happening. For small businesses in Jamaica, Trinidad and Tobago, Barbados, The Bahamas and across the Caribbean, the right approach to business intelligence can begin with tools you already use to run your operations.
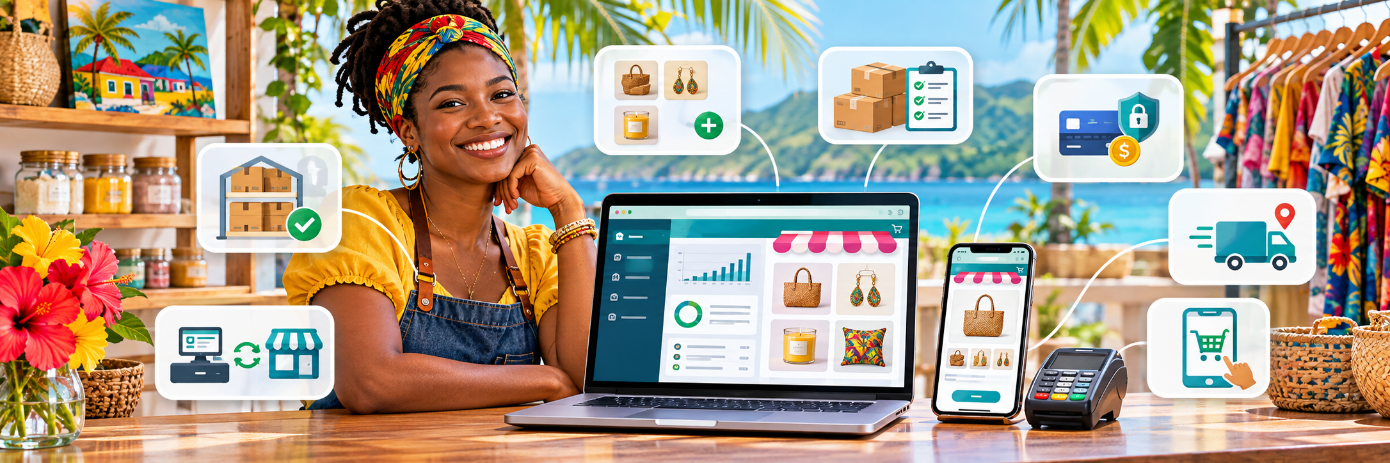
 Illustrative image: a Caribbean small-business owner reviewing sales and performance data.
You do not have to start with an expensive enterprise analytics system. You can build a business intelligence software workflow with Faddishbuilder by capturing useful operational data through your online store, point-of-sale system and customer relationship management tools, then use the reports to make better day-to-day decisions. This guide explains what business intelligence means, which metrics matter and how to put your business data to work.
What Is Business Intelligence Software?
Business intelligence (BI) is the process of collecting, organizing, analyzing and presenting business data so people can make better decisions. Business intelligence software supports that process through sales reports, visual dashboards, data analysis and performance tracking. As Microsoft explains in its introduction to BI, the process connects data collection and analysis with visual reporting and informed action.
Imagine a clothing store that sells both online and at the counter. Its owner may have hundreds of transactions, supplier purchases, returned items and customer inquiries every month. Those records are useful individually, but they become much more valuable when the owner can answer questions such as:
- Which five products generated the most sales this month?
- Do customers spend more online or in person?
- Which products are running low before busy weekends?
- Are discounts increasing orders but reducing margins?
- How much revenue is recorded, and how much has actually been collected?
The goal is not to collect more numbers. It is to identify the next useful action. A sales report is data; deciding to reorder a popular item before Carnival or reduce spending on slow-moving stock is business intelligence in practice.
How business intelligence works
A simple BI workflow follows five stages: capture data → check its quality → compare results → identify a pattern → take action. Data may come from an ecommerce store, POS terminal, CRM, booking calendar, invoices or other systems. Businesses with more complex requirements may use dedicated BI platforms to combine many independent data sources, build custom dashboards and automate analysis.
Why Small Businesses in the Caribbean Need Business Analytics
Caribbean businesses operate across different currencies, payment methods, customer habits and seasonal demand. A shop in Kingston may serve both walk-in and online customers. A beauty studio in Port of Spain may have appointments booked days in advance. A tour operator in Providenciales may experience substantial changes in demand between peak tourism periods and quieter months.
In all three cases, business analytics tools help owners focus on evidence rather than assumptions. The most useful benefits are practical:
- Better inventory planning. Compare sales by product and category before placing another order.
- More consistent cash-flow monitoring. Separate recorded sales from paid invoices, refunds and outstanding balances.
- Smarter staffing. Review sales or bookings by time period to decide when extra help may be needed.
- Improved customer relationships. Understand repeat purchases, active customers and outstanding follow-ups.
- More effective marketing. Evaluate results before repeating a promotion, discount or social campaign.
The currency context matters too. If your operations involve JMD, TTD, BBD, XCD or USD, do not add all amounts together without a defined conversion method and exchange-rate date. You can monitor each currency separately, or convert consistently when preparing a consolidated report.
Business Intelligence Software vs. Spreadsheets: What Is the Difference?
A spreadsheet can calculate totals and create charts, so it is often a good starting point. The problem comes when important business information is scattered across notebooks, separate tills, email messages and multiple spreadsheets. Manual re-entry adds work and creates opportunities for errors.
| Reporting need Spreadsheet-only workflow Connected operational tools | ||
| Daily sales | Enter totals manually | Review recorded transactions and POS reports |
| Inventory | Update stock sheets by hand | Track stock as online and in-person sales occur |
| Customers | Maintain separate contact lists | Use CRM records and related workflows |
| Invoices | Reconcile multiple files | Review invoice balances and payment status |
| Management review | Build each summary from scratch | Begin with the reports available in each app |
This does not mean every all-in-one business platform is a dedicated enterprise BI system. Specialist solutions may offer custom data models, multi-source data warehouses, advanced statistical analysis and self-service visualization. Faddishbuilder focuses on the operational applications and reporting that help businesses capture and review the information they need to run day to day. For advanced cross-platform analysis, an exported report can be reviewed in a spreadsheet or compatible BI tool.
How to Use Faddishbuilder as a Business Intelligence Toolkit
Faddishbuilder combines business applications in one platform. Its reporting features can help you see what is happening in retail, online selling, customer relationships, bookings and payments. Here is how each tool fits into a practical business intelligence strategy.
1. Track sales and inventory with FaddishPOS
With FaddishPOS point-of-sale software, you can record in-person transactions and review reports by item, category, employee, payment type and terminal. The POS page also describes reporting for discounts, taxes, refunds and cash movements. That provides a stronger foundation for retail analytics than a total written in a cash book at the end of the day.
Try this: At the end of each week, identify your highest-selling items, review discounts and refunds, and check which product categories contribute the most revenue. Compare those results with stock on hand. If a fast-selling product is consistently running out, consider a reorder point rather than waiting until the shelf is empty.
For businesses operating several locations, the FaddishPOS overview also describes multi-location support and sales analytics. Check your plan and configuration for the features available to your account.
2. Measure ecommerce performance with your online store
An online shop generates valuable business intelligence: number of orders, revenue, average order value, taxes and shipping charges. The Faddishbuilder online store includes store reports and CSV export, allowing you to review these measures or analyze them further in a spreadsheet.
One useful ecommerce KPI is average order value (AOV):
AOV = Revenue from orders ÷ Number of orders
For example, if a store records J$750,000 in order revenue from 300 orders, its AOV is J$2,500. If that business wants to increase its typical basket size, it could test complementary product bundles and then compare AOV and profit margin before and after the change. The example is illustrative, not a Faddishbuilder customer result.
You can also use the online store and POS with the same product catalogue, helping keep stock information more consistent between ecommerce orders and counter sales. That is especially useful for businesses selling through both channels.
3. Use FaddishCRM for customer and financial insights
Sales growth does not depend only on attracting new customers. Retaining existing customers, following up on opportunities and collecting invoices matter as well. FaddishCRM provides customer records, project and task management, invoicing and reporting on customer activity, team productivity and revenue trends.
Try this: Review overdue invoices, follow-ups that have not been completed and customers who may need a new quotation. Separate money that is invoiced from money that has been paid. That distinction makes your cash-flow picture more reliable and can help your team prioritize collections.
A simple CRM analytics routine might track new customer inquiries, quotations sent, invoices paid and repeat customers each month. Use the same definitions and time periods so the comparisons are meaningful.
4. Find booking trends with FaddishBooking
Appointments are valuable operational data for salons, consultants, barbers, spas and other service businesses. FaddishBooking supports customer self-booking, schedules, staff availability, confirmations, reminders and local-currency payment options.
Try this: Review upcoming and completed appointments to identify popular services, commonly requested days and staff scheduling pressure. Compare cancellations or missed bookings using the records you maintain. You may discover that Saturdays need longer opening hours or that some services should be promoted on quieter weekdays.
Booking data can support management decisions even where the booking application does not provide a specialist forecasting dashboard; export or record the relevant counts separately if needed.
5. Improve payment visibility with FaddishPay and invoices
A business can be busy and still struggle with liquidity. FaddishPay payment links and the platform's invoice workflows can help organize how customers are asked to pay and how payments are confirmed. Use payment confirmations, paid/unpaid invoice records and reconciliation against bank or gateway settlements to understand collection performance.
For better financial reporting, track invoice amounts, payments collected, refunds, gateway fees and outstanding balances as distinct measures. A payment notification is not a substitute for reconciling the final settlement into your bank account.
 Conceptual illustration of combining operational insights. This is not a screenshot or a claim that Faddishbuilder provides an automated enterprise data warehouse.
Watch: Business Intelligence and Smarter Business Operations
See the video below as a companion to this guide. Then use the checklist that follows to turn your own business records into a repeatable reporting routine.
Step-by-Step: Build a Weekly Business Intelligence Reporting Routine
You do not need dozens of dashboards to start. Aim for one management review that answers five questions: What sold? What changed? What is owed? What needs attention? What will we do next?
Step 1: Set up the Faddishbuilder apps you actually need
Create your account through Faddishbuilder. A retailer might activate an online store and POS; a salon might focus on booking, CRM and payments; a service company might use CRM and invoicing. Review current plans and feature availability before relying on a specific module.
Step 2: Capture transactions consistently
Record sales in your POS, process store orders through the ecommerce workflow, maintain customer records and keep invoice statuses updated. Use consistent product names, categories and service labels. Incorrect records produce misleading insights, regardless of how attractive a dashboard looks.
Step 3: Select five to eight KPIs
Start with metrics that influence decisions, not vanity numbers. For a retail store, that might be sales revenue, order count, AOV, top products, refunds, stockouts and paid versus unpaid invoices. A booking-based business can replace product KPIs with appointments, completed services and schedule utilization.
Step 4: Review reports every Monday
Open your relevant Faddishbuilder reports. Compare the latest complete week against the week before, and distinguish weekends, public holidays and seasonal events. Where you need a combined cross-app report, use available CSV exports and a spreadsheet rather than assuming different applications automatically merge every metric into one BI dataset.
Step 5: Choose one action and measure the result
Maybe the data suggests reordering a bestseller, following up with late-paying customers or changing staff coverage. Record the decision, who is responsible and when you will review its impact. The next reporting session should show whether the action helped.
Key Business Intelligence KPIs Every Small Business Should Know
| KPI How to calculate or interpret it Management question | ||
| Sales revenue | Sales recorded within the chosen period | Are sales rising or falling? |
| Order count | Number of orders or transactions | Is demand changing? |
| Average order value | Order revenue ÷ number of orders | Are customers buying more per order? |
| Gross margin | (Net sales − cost of goods sold) ÷ net sales × 100 | Are sales profitable before overheads? |
| Refund rate | Refunded orders ÷ orders × 100 | Are product or service issues increasing? |
| Stockout frequency | Number of times an item becomes unavailable | Are inventory gaps costing sales? |
| Outstanding receivables | Unpaid invoice balances | How much is still to be collected? |
| Booking utilization | Booked service time ÷ available service time × 100 | Are appointment slots being used efficiently? |
Important: Not every metric above is a built-in Faddishbuilder report. Some, such as gross margin, refund rate or booking utilization, may require additional cost data, manually calculated figures or spreadsheet analysis. Define whether revenue includes taxes, discounts, shipping and refunds before comparing periods.
Three Real-World Business Intelligence Examples
Example A: A Kingston fashion retailer
A boutique uses the online store and cloud POS to record ecommerce and counter transactions. The owner checks sales by item, product category and payment method. Before ordering new stock, the owner identifies slow-moving sizes and popular styles, then adjusts the purchasing plan. The result to measure is not just increased sales, but fewer stockouts and less money tied up in unsold inventory.
Example B: A Trinidad beauty studio
A salon uses online appointment booking to organize availability and customer management software to manage client relationships and invoices. The manager reviews the busiest booking days and the frequency of repeat visits. Based on the findings, the salon tests extra capacity for peak periods and targeted offers on quieter days, then checks whether utilization improves.
Example C: A Bahamas-based service provider
A consulting company uses CRM tasks, project tracking and invoices to keep client work organized. During its weekly review, it notices that completed jobs are not always followed by prompt invoicing. The team introduces a simple end-of-project invoice checklist and monitors unpaid balances. Business intelligence here is not a sophisticated chart; it is detecting a process problem and taking measurable action.
How to Choose Business Intelligence Software for a Growing Business
Before buying a dedicated BI platform or adding another analytics subscription, ask what decisions you actually need to make. A useful small business intelligence solution should make data easier to trust, interpret and act on.
Look for clear reporting on the business activities you manage, understandable KPIs, reliable exports, access controls for staff and reporting that matches your operating currencies. Consider integration requirements, data privacy, support, training and the total cost of ownership—not just the subscription fee.
If your challenge is capturing sales, bookings, customer details and invoices consistently, starting with a platform such as Faddishbuilder may be the logical first step. If you later need enterprise data modeling, cross-company consolidation, advanced forecasting or automated integration with many external databases, you may also need a specialized BI product. These approaches can complement each other rather than compete.
Frequently Asked Questions About Business Intelligence Software
What is the best business intelligence software for a small business?
The best choice depends on your reporting needs. A business mainly trying to track sales, customers, invoices and bookings may get useful insights from its operational platform. Businesses that need complex, custom analysis across multiple systems should evaluate specialist business intelligence tools too.
Can small businesses use business intelligence without hiring a data analyst?
Yes. Begin with a handful of KPIs, consistent records and a weekly review. Many useful questions—such as what sold, which invoices are unpaid and which products need replenishment—can be answered with straightforward business reporting.
Does Faddishbuilder offer business analytics and reporting?
Yes. Its official product pages describe reporting features in its POS, online store and CRM applications, including sales and operational insights. However, those features should not be confused with a dedicated enterprise BI data warehouse or fully customizable analytics suite.
How often should I review my business intelligence dashboard?
Review immediate operational exceptions, such as stockouts or failed collections, as often as necessary. For many small businesses, a weekly management report and a deeper monthly trend review provide a useful starting rhythm.
What is the difference between business intelligence and business analytics?
The terms overlap. Business intelligence commonly focuses on collecting and presenting information about current and past performance. Business analytics can involve deeper exploration, statistical models or forecasting. Both aim to improve decisions using evidence.
Can I use Faddishbuilder data with another BI tool?
Faddishbuilder's online store page documents CSV export for store reports. Those exports can be analyzed in spreadsheets and, where compatible, imported into external BI applications. Do not assume a native live connector or automatic two-way synchronization unless the specific integration is documented.
Start Making More Informed Business Decisions with Faddishbuilder
Business intelligence is most valuable when it changes what you do next. You can begin with accurate sales data, regular reporting and a few useful KPIs—then expand your analysis as your business grows.
Whether you run a retailer in Jamaica, a salon in Trinidad and Tobago, a restaurant in Barbados or a service company elsewhere in the region, explore Faddishbuilder's all-in-one business platform to manage the everyday operations that generate useful business insights. From online store reporting and point-of-sale analytics to customer relationship management, the first step toward data-driven growth is getting your business information organized.